
A sales process flowchart is just a visual map that lays out every single step a lead takes, from the first "hello" all the way to a closed deal. It’s the playbook that turns a messy, unpredictable sales motion into a reliable system for hitting your numbers.
Why Your Sales Team Needs a Flowchart Now
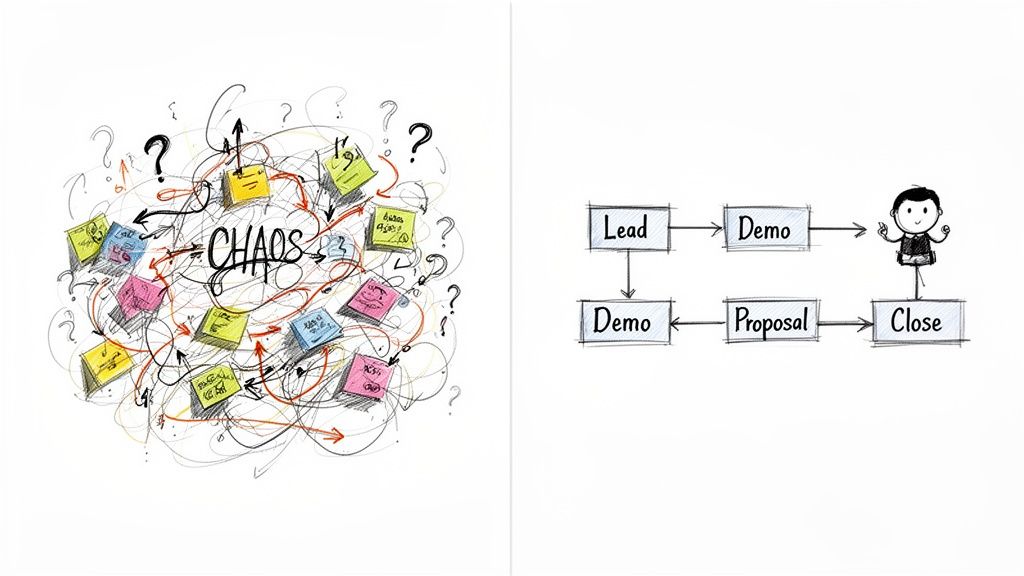
Let's be honest. Without a clear process, sales can get chaotic. Really chaotic. Reps end up following their own gut feelings, hot leads from marketing get dropped, and trying to forecast revenue feels like a total guessing game. A sales process flowchart isn't just some diagram you stick on a wall; it's the playbook that brings desperately needed clarity and consistency to your entire sales operation.
Think about onboarding a new rep. Imagine they could get up to speed in half the time because they have a visual guide for every step. Or think about the confidence your team gets when they know exactly what to do next to move a deal forward, instead of just winging it. This isn't about adding bureaucracy—it's about building a solid foundation you can actually scale on.
From Chaos to Clarity
I once worked with a small B2B tech company that just brought on two new sales reps. Before they had a flowchart, their "process" was just tribal knowledge locked in the founder's head. The reps did their best, but one would schedule a demo right away while the other sent a long chain of emails. The result? A totally inconsistent customer experience and a lot of stalled deals.
Once they put a simple sales process flowchart in place, everything changed. The team finally had:
Standardized Stages: Everyone knew exactly what "Qualified Lead" or "Demo Completed" actually meant. No more guessing.
Clear Handoffs: The marketing team knew what information sales needed when they passed over a new lead.
Actionable Steps: The flowchart spelled out what to do if a lead went cold—move them to a nurture sequence instead of just forgetting about them.
That simple visual turned their reactive, messy sales efforts into a proactive, efficient engine. The new reps ramped up faster, and the whole team started working from the same playbook. When you connect this to an AI-powered revenue platform, you can lock in that process even further.
The data backs this up. Companies with a formal, documented sales process see 27% higher win rates and 21% higher quota attainment than those without one. A flowchart isn't just a nice-to-have; it directly drives better performance.
This is how small and growing businesses stop relying on scrappy, inconsistent tactics and start building a predictable system for growth. It standardizes what works, makes your forecasts more accurate, and ultimately helps your team close more deals.
An effective flowchart isn't complicated. It just needs to clearly define the key elements that guide your team from one step to the next.
Core Components of an Effective Sales Flowchart
Component | Description | Example for an SMB |
|---|---|---|
Stages | The distinct phases a deal moves through, from initial contact to close. | New Lead > Contacted > Qualified > Demo Scheduled > Proposal Sent > Closed-Won |
Activities | The specific actions reps must take to move a deal to the next stage. | Send intro email, make discovery call, conduct product demo, create a quote. |
Roles | Who is responsible for each activity (e.g., SDR, AE, Sales Manager). | SDRs qualify leads, AEs run demos and close, Managers approve discounts. |
Decision Points | The "if/then" logic that determines the next step in the process. | If a lead is not qualified, move to a nurture sequence. If a demo is no-show, reschedule. |
Handoffs | The point where responsibility for a lead or deal transfers to another person or team. | Marketing hands off a Marketing Qualified Lead (MQL) to an SDR for qualification. |
Tools & Data | The systems and information needed at each step (CRM fields, templates, etc.). | Update the "Lead Status" field in the CRM; use the approved proposal template. |
By mapping out these core components, you create a complete playbook that eliminates ambiguity and empowers your reps to follow best practices consistently.
Defining Your Core Sales Stages and Roles
Before you ever touch a flowcharting tool, you have to get your definitions straight. This is the bedrock of a repeatable sales process. It’s all about creating a shared language for your entire revenue team so everyone knows exactly what a specific stage means.
Without this, one rep’s “Qualified” is another’s “Just Browsing.” That ambiguity is where handoffs get dropped, leads go cold, and your pipeline starts to leak.
The whole point is to swap vague, gut-feel assessments for concrete, measurable milestones. Get your sales and marketing leads in a room (even a virtual one) and hammer this out. The only goal is to agree on the exact definitions for each step a customer takes, from their first click to a signed contract.
From Lead to Closed Deal: An Example
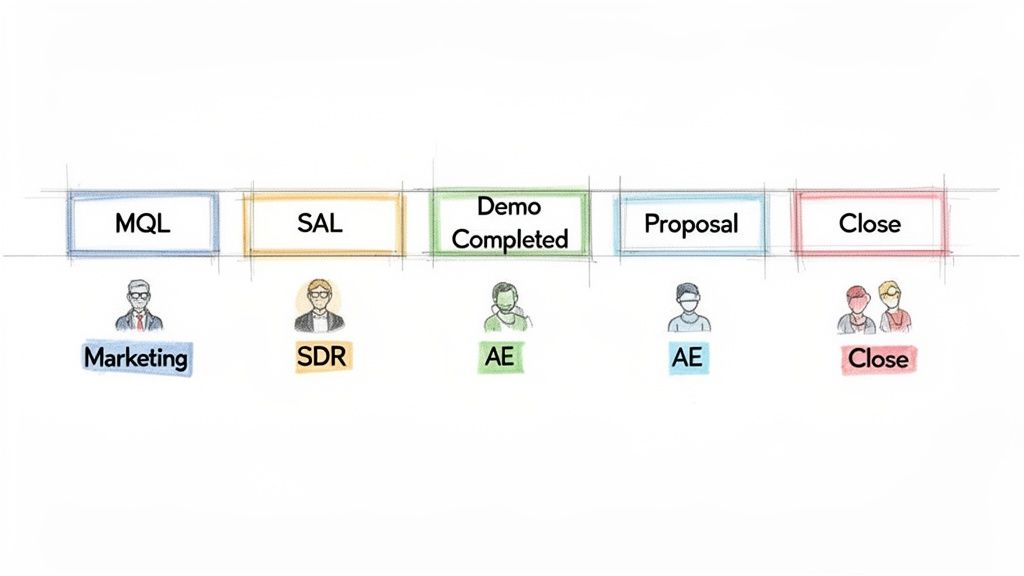
Let's make this real. Here’s how a typical B2B SaaS company might define its core sales stages. This kind of clarity means that when a lead moves from one column to the next in your CRM, it actually signifies progress.
Marketing Qualified Lead (MQL): A lead showing interest by engaging with marketing content, like downloading an ebook or—even better—requesting a demo. They also meet basic firmographic criteria, like company size or industry.
Sales Accepted Lead (SAL): The MQL has been reviewed by a Sales Development Representative (SDR) who confirms it fits your Ideal Customer Profile (ICP). The SDR has verified the contact info and agrees the account is worth pursuing.
Discovery Call Completed: The SDR held an initial call, qualified the lead using a framework like BANT (Budget, Authority, Need, Timeline), and successfully booked the next meeting with an Account Executive (AE).
This level of detail is non-negotiable. It kills the friction between marketing and sales, making handoffs clean and efficient.
The biggest takeaway here? Every single stage needs clearly defined entry and exit criteria. A deal can’t enter the 'Demo Completed' stage until the demo actually happened, and it can't leave until a proposal has been formally requested. Simple as that.
Assigning Clear Ownership
Just as critical as defining the stages is assigning ownership. A lead without an owner is a lost opportunity—period. I’ve seen more pipelines leak from ownership ambiguity than almost any other issue. Leads get stuck between teams or even between individual reps.
Your sale process flowchart has to spell out exactly who is responsible for what.
This creates a clear chain of accountability. For instance:
Marketing Team: Owns generating MQLs. Their job is to fill the top of the funnel with qualified interest.
SDRs (Sales Development Reps): Own the SAL stage. Their sole focus is qualifying MQLs and booking solid meetings for the AEs.
AEs (Account Executives): Own the opportunity from the first real meeting (like a demo) all the way to close.
When roles are this clear, everyone knows their job. SDRs aren’t trying to close deals, and AEs aren’t wasting their time on junk leads. This specialization turns your sales engine into a well-oiled machine and your flowchart into a playbook your team can actually execute.
Mapping the Actions and Decisions in Your Process
Okay, you’ve defined your sales stages and assigned roles. Now it's time to connect the dots. This is where your abstract process becomes a practical, visual playbook any rep—new or veteran—can use to see the exact path a lead should take.
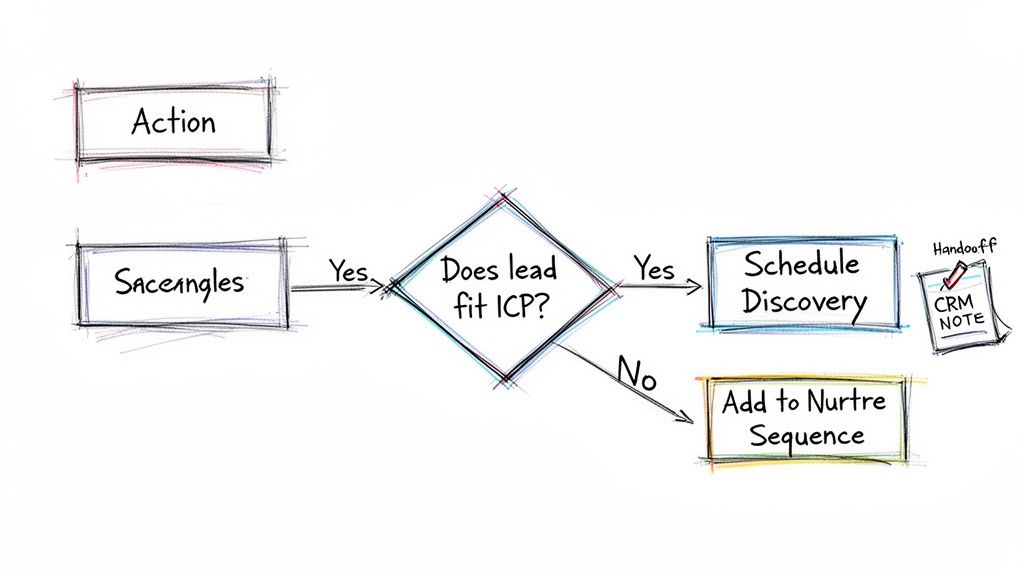
The basic building blocks of any sale process flowchart are incredibly simple. Think of rectangles for actions (like "Send Follow-up Email") and diamonds for decisions (like "Is the Lead Qualified?"). This simple visual language gets rid of ambiguity and turns high-level stages into concrete, actionable steps.
Tracing the Path of a Demo Request
Let’s walk through a common scenario. An inbound lead fills out a "Request a Demo" form on your website. What happens next? This is precisely where your flowchart brings clarity.
The very first step is a decision point, a critical question that steers the lead's entire journey: Does this lead fit our Ideal Customer Profile (ICP)?
YES: If their company size, industry, and role match your ICP, the path moves forward. The SDR is prompted to reach out and book a discovery call. Simple.
NO: But what if it’s a student or a competitor? The path branches off. The right action here is to add them to a low-touch, long-term nurture sequence. This keeps your brand on their radar without wasting your sales team's valuable time.
This simple "yes/no" branch is one of the most powerful parts of a sales flowchart. It automates triage and makes sure your team only focuses on high-potential leads. In fact, studies show a formalized sales process can lead to 27% higher win rates because it systematizes these exact best practices.
Defining Critical Handoffs
Another make-or-break moment to map is the handoff. This is when a lead moves from one person to another, like from an SDR to an Account Executive (AE). A dropped handoff is one of the easiest ways to lose a perfectly good deal.
Your flowchart needs to define the exact criteria for a handoff. For instance, before an SDR can pass a lead to an AE, they must confirm the following:
The discovery call is complete.
Key BANT info (budget, authority, need, timeline) is documented in specific CRM fields.
A firm date and time for the demo with the AE is officially on the calendar.
A handoff isn't just passing over a name and email. It's a transfer of context, trust, and responsibility. Your flowchart should act as a non-negotiable checklist, ensuring the AE has everything they need to run the next play successfully.
By mapping these actions, decisions, and handoffs, you’re creating a visual guide that takes the guesswork out of selling. It’s the foundation of a repeatable, scalable system. For a deeper look at optimizing these internal movements, check out our guide on how to create a workflow that truly supports your team. This helps turn your flowchart from a static diagram into a dynamic tool that actively guides everyone toward closing more deals.
Bringing Your Flowchart to Life in Your CRM
A flowchart on a whiteboard is a great starting point, but it doesn't mean much until your team actually uses it. The real magic happens when you embed that sale process flowchart directly into the one place your team works all day: your CRM.
This is how you turn a static diagram into a living, breathing system. It builds the guardrails that keep everyone on the same page, guiding reps through the right steps at the right time. Instead of just hoping reps remember what to do, the CRM enforces your best practices.
Mirror Your Stages in the Pipeline
First things first: your CRM's sales pipeline needs to be an exact mirror of your flowchart. If your diagram has stages like "Qualified," "Discovery Call Booked," and "Proposal Sent," your CRM pipeline should have columns with those exact names.
This alignment makes the process tangible. When a rep drags a deal from one column to the next, they’re physically moving it through the process you designed. In a platform like Stamina, you can set this up in just a few minutes.
This simple move is a game-changer. Suddenly, your pipeline report isn't just a list of deals. It's a real-time snapshot of your entire sales motion, showing exactly where every single opportunity stands.
Getting this right is more important than ever. The market for digital sales rooms hit $1.2 billion in 2024 and is projected to reach $6.5 billion by 2033. That growth shows just how critical it is to have a CRM and sales process that are perfectly in sync.
Automate the Busywork
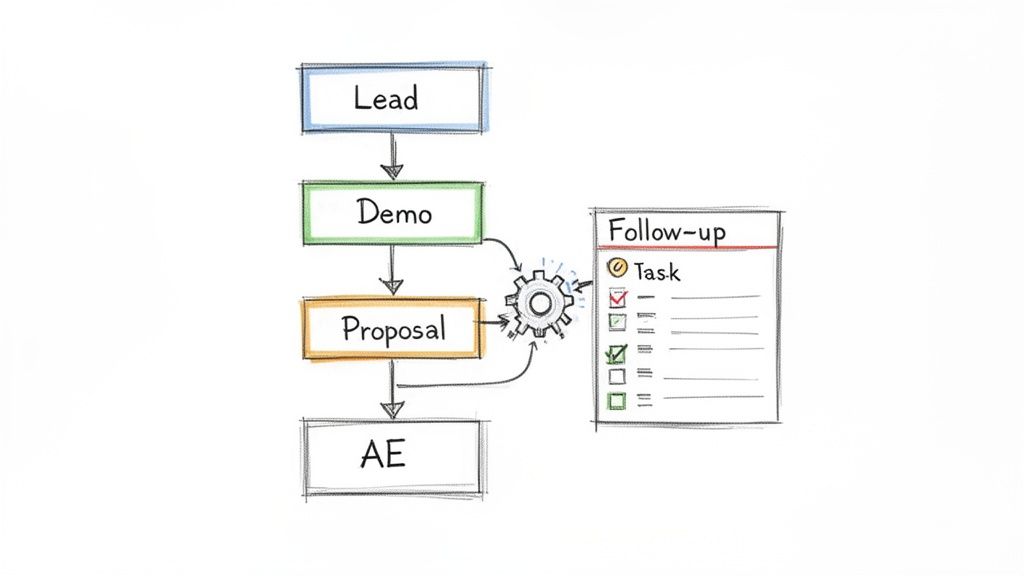
With your stages locked in, you can start automating the grunt work. A good CRM lets you build simple "if-this, then-that" rules that take care of the repetitive tasks that reps always forget. This is where your flowchart stops being a document and starts being an active part of your team.
Here are a few automations I see work wonders:
Task Creation: When a deal moves to the "Proposal" stage, automatically create a task for the account executive to follow up in three days. No more sticky notes.
Lead Rotation: As soon as a new lead is marked "Qualified," have the system automatically assign it to the next rep in line. It’s fast, fair, and eliminates cherry-picking.
Data Enrichment: The moment a deal enters the "Discovery" stage, trigger a workflow to pull in key company details or contact information from an enrichment tool.
These small automations free up your reps to do what they do best: sell.
Align Your CRM Data Fields
Finally, make sure the data you're collecting matches what's needed at each stage. Your flowchart should define the key information reps need to gather, and your CRM should enforce it.
For example, if reps absolutely must confirm budget during the discovery call, make "Budget" a mandatory field they have to fill out before moving the deal to the next stage. It sounds simple, but it ensures you capture the right information at the right time, every time.
This alignment turns your CRM from a simple address book into the data-driven engine that powers your sales machine. For more on this, check out our guide on designing a flexible CRM data model that can grow with your process.
Using Data to Optimize Your Sales Process
Getting your first sales process flowchart on paper is a great start. But don't let it gather dust. The real magic happens when you treat it like a living, breathing tool—something you constantly tweak based on what’s actually happening on the ground.
This is how you move from just having a process to actively managing one. Without data, any changes you make are just shots in the dark. By tracking the right numbers, you can see exactly where deals get stuck, what’s working, and which parts of your flowchart desperately need a tune-up.
This is what turns your sales process from a hopeful guess into a predictable engine for growth.
Key Metrics to Monitor in Your Sales Flowchart
To find the bottlenecks, you have to know what to look for. A few key numbers tell a powerful story about where your process is strong and where it's breaking down.
Stage-to-Stage Conversion Rates: This is the big one. It's the percentage of deals that successfully move from one stage to the next. A low conversion rate between "Demo Completed" and "Proposal Sent" is a massive red flag. It tells you your demos aren't creating enough value or urgency.
Sales Cycle Length: How long does it take for a deal to move from start to finish? If your average sales cycle is creeping up, it could mean reps are getting bogged down, or deals are stalling out without a clear next step defined in your process.
Deal Slippage: This tracks how many deals you forecasted to close this month that got pushed to the next. High slippage often points to weak qualification or a lack of defined follow-up activities in your flowchart.
Suddenly, you’re not just saying, "we need to close faster." You're saying, "we need to fix the 25% drop-off we're seeing after the proposal stage." That specificity is what drives real improvement. You can even run simple ad-hoc reports to dig into these numbers whenever you spot a trend.
Your CRM should be your source of truth here. We're going to set up a quick table to show which metrics are most important at each stage.
Key Metrics to Track for Each Sales Stage
Sales Stage | Key Metric | What It Tells You |
|---|---|---|
New Lead / MQL | Lead-to-Opportunity Conversion Rate | Are your marketing leads high-quality? Are reps following up effectively? |
Discovery / Qualification | Time Spent in Stage | Are reps qualifying deals quickly, or are they stuck in endless discovery loops? |
Demo / Presentation | Demo-to-Proposal Rate | Do your demos build enough value and urgency to warrant a proposal? |
Proposal Sent | Proposal-to-Negotiation Rate | Is your pricing clear and compelling? Are you getting ghosted after sending the quote? |
Negotiation | Deal Slippage Rate | Are deals getting stuck on price or terms? Is your team properly equipped to handle objections? |
Closed Won / Lost | Win Rate & Sales Cycle Length | How effective is your process overall? How long does it take to get a "yes"? |
Tracking these numbers gives you a diagnostic tool for your entire sales motion. When a metric looks off, you know exactly which part of the flowchart to investigate.
I’ve seen teams completely transform their results by focusing on just one weak conversion point. For example, a team might find that most of their deals stall out right after a demo. By digging into the data, they realize they aren't confirming budget early enough. A simple tweak to their flowchart—adding a mandatory "Budget Confirmed" checkbox before the demo stage—can change everything.
The Power of Weekly Pipeline Reviews
Data is useless if it just sits in a dashboard. The best way to make it actionable is to build a rhythm around it, and the weekly pipeline review is the perfect place for that. This is where sales pipeline analysis becomes a core discipline for any high-performing team.
Think about it: during a review, you see five deals have been stuck in the "Negotiation" stage for over three weeks. This isn't just a number; it's a clear signal to investigate.
This is where your flowchart becomes a powerful coaching tool. You can pull it up and ask targeted questions:
Did we follow the defined negotiation steps?
Are we engaging with the right decision-maker as mapped in our process?
What objection-handling tactics from our playbook have we tried?
This connects performance data directly back to your process, allowing you to make adjustments based on evidence, not guesswork. Your flowchart stops being a theoretical map and becomes an active diagnostic tool that helps you build a more predictable revenue machine.
Common Questions About Sales Flowcharts
Even after mapping everything out, a few questions always pop up when it's time to put a new sales flowchart into action. Let's tackle the most common ones I hear from teams to make sure your rollout goes smoothly.
Getting these details right is what turns your flowchart from a nice diagram into a practical tool your reps actually use every single day.
How Often Should We Update Our Sales Flowchart?
Your sales flowchart should be a living document, not a "set it and forget it" project. I've found a quarterly review is the sweet spot. It gives you enough time to collect meaningful data on what’s working (and what’s not) without letting your process get stale.
That said, you can't wait three months if something big changes. You’ll want to do an immediate update for key business shifts like:
Launching a new product or service.
Targeting a completely new market or customer profile.
Switching to a new core sales tech, like a different CRM.
Hearing the same feedback over and over from your reps about a specific bottleneck.
You might also find yourself making small tweaks after a monthly pipeline review when you spot a recurring hang-up. The goal is to keep the flowchart aligned with how your team actually sells today, not how they sold six months ago.
What Is the Difference Between a Sales Process and a Sales Methodology?
This trips people up all the time, but the difference is pretty simple once you see it. Think of it like a road trip.
Your sales process is the "what"—it's the map. It shows the concrete, sequential stages a prospect moves through, from Qualification to Discovery and on to a Demo. Your flowchart is the visual version of this map.
Your sales methodology is the "how"—it's your driving style. It’s the framework or philosophy your team uses to navigate that map. Think Challenger Sale, MEDDIC, or SPIN Selling. The methodology tells you what to do and say inside each stage of your process to move a deal forward.
You absolutely need both. The process gives your team structure and predictability. The methodology gives them the skill and strategy to win deals within that structure.
Can a Small Team Benefit from a Flowchart?
Absolutely. In fact, it might be the most important time to build one. For a small team—even just one to three reps—a sales flowchart isn't about creating bureaucracy. It's about building a solid foundation you can grow on.
It gets good habits baked in from day one, replacing "gut feel" with a repeatable system. This makes onboarding your next hire at least 50% faster because you're handing them a playbook, not a vague set of instructions.
Plus, it means you start tracking the right data from the very beginning, which is the only way to scale your sales without everything breaking.
Ready to build a sales process that scales? Stamina unifies your marketing, sales, and CRM into one AI-powered platform, helping you turn your flowchart into an automated revenue engine. Learn how Stamina can help you close more deals.

