Business Intelligence Retail Industry: Key Strategies 2026

Master business intelligence retail industry strategies. Explore metrics, architecture, implementation, vendor selection, ROI, & SMB steps for 2026 success.

0 - Minute Read

A small retail team can spend half its week hunting for answers that should be obvious. One spreadsheet tracks store sales. Another holds Shopify orders. A third comes from the email platform. Inventory lives somewhere else. By the time someone merges the files, the promotion is over and the stock problem has already reached the store floor.

That's why the most important retail BI story isn't about prettier dashboards. It's about the gap between what retailers need and what small teams are able to run. 73% of retailers cite the need for real-time intelligence, but only 12% of SMBs have the infrastructure for continuous AI-driven replenishment and pricing optimization. That gap is where many growing retailers get stuck.

Introduction to Retail BI for SMBs

Consider a local retail brand with three stores, an online shop, and a lean team. The owner checks POS reports in the morning, the e-commerce manager watches online orders, and the marketer exports email results every Friday. Everyone has data. No one has the same version of the business.

That's the practical starting point for business intelligence in the retail industry. BI gives a retail team one place to see what's selling, what's slowing down, which customers are responding, and where action is needed next. For a small business, that doesn't mean building an enterprise data department. It means replacing scattered reports with a system that helps people decide faster.

The confusion usually starts with the phrase “real-time BI.” Many SMB teams assume it means expensive infrastructure, full-time analysts, and a complete rebuild of their tech stack. It doesn't have to. Real-time BI means the business isn't waiting for end-of-week summaries to react to stock shifts, customer behavior, or campaign performance.

Practical rule: If your team still needs to copy data from one tool into another before making a decision, you don't have a BI workflow yet. You have reporting labor.

Retailers also mix up BI with customer engagement tools. They're connected, but they aren't the same. BI tells you what is happening and what action makes sense. Engagement tools help you deliver that action across channels. If you want a useful primer on that second piece, this explanation of a customer engagement platform helps clarify where communication and analytics meet.

For SMB retailers, the goal isn't to become “data-driven” in some abstract way. The goal is simpler. Spot a likely stockout before it hurts sales. Notice when a campaign is pulling online demand from a specific store region. Identify which customers respond to bundles instead of discounts. Then act while the moment still matters.

Understanding Business Intelligence in Retail Industry

Business intelligence in retail works like a store manager who can stand in every aisle, watch every checkout, compare every channel, and alert the team before a problem gets expensive. Traditional reporting gave that manager a clipboard after the fact. Modern BI gives them a live control room.
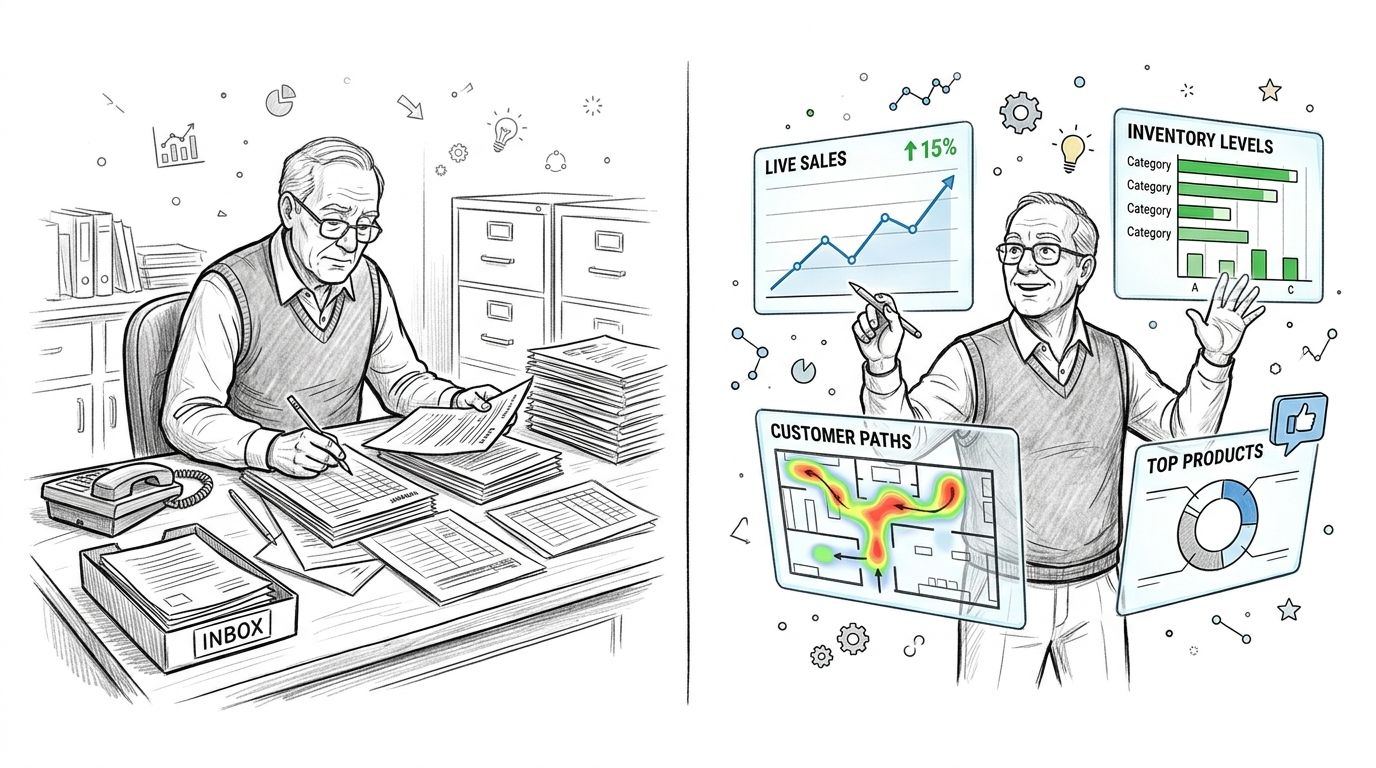
A split image contrasting a man doing manual paper work versus using digital business intelligence analytics tools.

From reporting to action

Older BI setups mostly answered one question. What happened?

You'd open a dashboard, review yesterday's sales, and maybe notice that one SKU underperformed in one store. That's useful, but it's late. Someone still has to interpret the chart, send an email, and update a system manually.

Modern retail BI has changed shape. Retail BI platforms now combine data ingestion, modeling, and activation in one continuous pipeline, shifting from periodic reporting to prescriptive, automated decisioning in milliseconds. That sentence sounds technical, so let's translate it.

It means the platform doesn't stop at showing you a chart. It can connect incoming data to a recommended action. If inventory drops quickly on a promoted item, the system can flag replenishment risk immediately. If certain customers are responding to a category on mobile but not in-store, the team can adjust targeting or merchandising without waiting for a weekly review.

That's why many teams now talk less about dashboards and more about decision systems. If you want a thoughtful outside perspective on that shift, Trackingplan's guide to autonomous business intelligence is a useful companion read.

What this looks like in daily retail work

In practice, retail BI touches familiar tasks:

  • Stock decisions: Which products need a reorder signal now, not tomorrow.

  • Pricing moves: Which categories may need tighter monitoring when demand changes quickly.

  • Promotion timing: Which campaigns are lifting response in one channel but not another.

  • Customer experience: Which shoppers are engaging with recommendations, abandoned carts, or repeat purchase patterns.

  • Store operations: Which locations are aligned with online demand and which are drifting.

The easiest way to understand the shift is this. A dashboard is like a rearview mirror. A modern BI system is closer to assisted driving.

A short visual walkthrough helps make that leap concrete:

Retail teams don't need more charts if the charts still leave the next move unclear.

Why omnichannel makes BI harder and more necessary

Retail used to tolerate separate systems because store and online operations were often run separately. That breaks down fast when customers move between channels without thinking about it. A shopper might discover a product on Instagram, compare it on the website, then buy it in-store. If your data lives in silos, your team sees fragments of one journey and mistakes them for separate stories.

That's why modern BI matters so much in retail. It doesn't just summarize activity. It helps teams connect behavior, demand, and response across channels so decisions match how customers shop.

Key Retail BI Metrics and Use Cases

Metrics matter because they narrow attention. A retail team can stare at dozens of charts and still miss the core issue. The best BI metrics answer a practical question tied to revenue, cost, or customer response.

Retailers implementing comprehensive BI solutions report an average 8.4% increase in sales volume within the first year and a 12.3% higher growth rate when they unify online and offline data. Those results help explain why the right metrics are more than reporting hygiene. They shape action.

The metrics that actually guide decisions

Some SMB teams over-focus on top-line sales because it's easy to measure. Sales matter, of course, but they don't tell you whether inventory is healthy, whether pricing is sustainable, or whether valuable customers are becoming more loyal.

Here's a decision-ready view of core retail BI metrics.

Metric

Definition

Impact

Inventory turnover

How often inventory sells through and is replaced over a period

Helps buyers reduce overstocks and spot slow-moving items before cash gets trapped

Forecast accuracy

How closely predicted demand matches actual demand

Improves purchasing, staffing, and replenishment decisions

Customer lifetime value

The expected value of a customer relationship over time

Helps marketers decide where retention and loyalty efforts deserve more focus

Price elasticity

How customer demand changes when price changes

Guides discount strategy and protects margin when testing pricing moves

Attribution rate

How clearly a sale can be connected to a campaign, channel, or touchpoint

Helps teams understand which actions are influencing purchases across online and offline journeys

How each metric shows up in real stores

Inventory turnover is often the first wake-up call. If one store keeps reordering a product that sits untouched while another location sells out, the issue may not be demand alone. It may be assortment, placement, or timing. BI helps the team see the mismatch early.

Forecast accuracy becomes critical during promotions and seasonal shifts. A spreadsheet forecast built from last month's sales often misses current behavior. BI tools pull in richer signals and make forecast adjustments easier to trust.

For teams that need a grounding in prediction methods, this guide to sales forecasting is a practical companion.

Customer lifetime value helps smaller retailers stop treating every buyer the same. A discount for a one-time bargain hunter and a personalized offer for a repeat customer shouldn't come from the same playbook.

Useful test: If your team can't explain which customer group deserves a retention offer and which group only needs low-cost nurture, your BI metrics aren't connected to action yet.

Price elasticity sounds advanced, but the logic is simple. Some products can handle a price shift with little drop in demand. Others can't. BI makes those patterns easier to observe across stores, channels, and periods.

Attribution rate becomes especially important in omnichannel retail, where a customer rarely buys in the same place they first engaged. If your email, paid social, web visits, and in-store purchases remain disconnected, your team may overfund the wrong campaign.

For a concrete operations example outside classic retail dashboards, Pipecorn's Foodcheri case study is useful because it shows how better data flow can support execution, not just reporting.

Use cases SMB teams can prioritize first

Instead of tracking everything, start where the business feels pain:

  • Recurring stock imbalances: Focus on turnover and forecast accuracy.

  • Discount-heavy growth: Track price elasticity and gross response by segment.

  • Weak repeat purchase behavior: Watch customer lifetime value patterns and cohort behavior.

  • Channel confusion: Improve attribution across in-store and digital activity.

The strongest retail BI programs don't begin with more KPIs. They begin with a few metrics that answer costly questions clearly.

Architecture and Data Sources for Retail BI

Retail BI architecture decides whether your team gets answers in time to act or spends the week stitching together exports. For SMB retailers, that difference often comes down to one question. Do your sales, customer, inventory, and campaign systems feed one shared model, or do they live in separate tools that never fully agree?
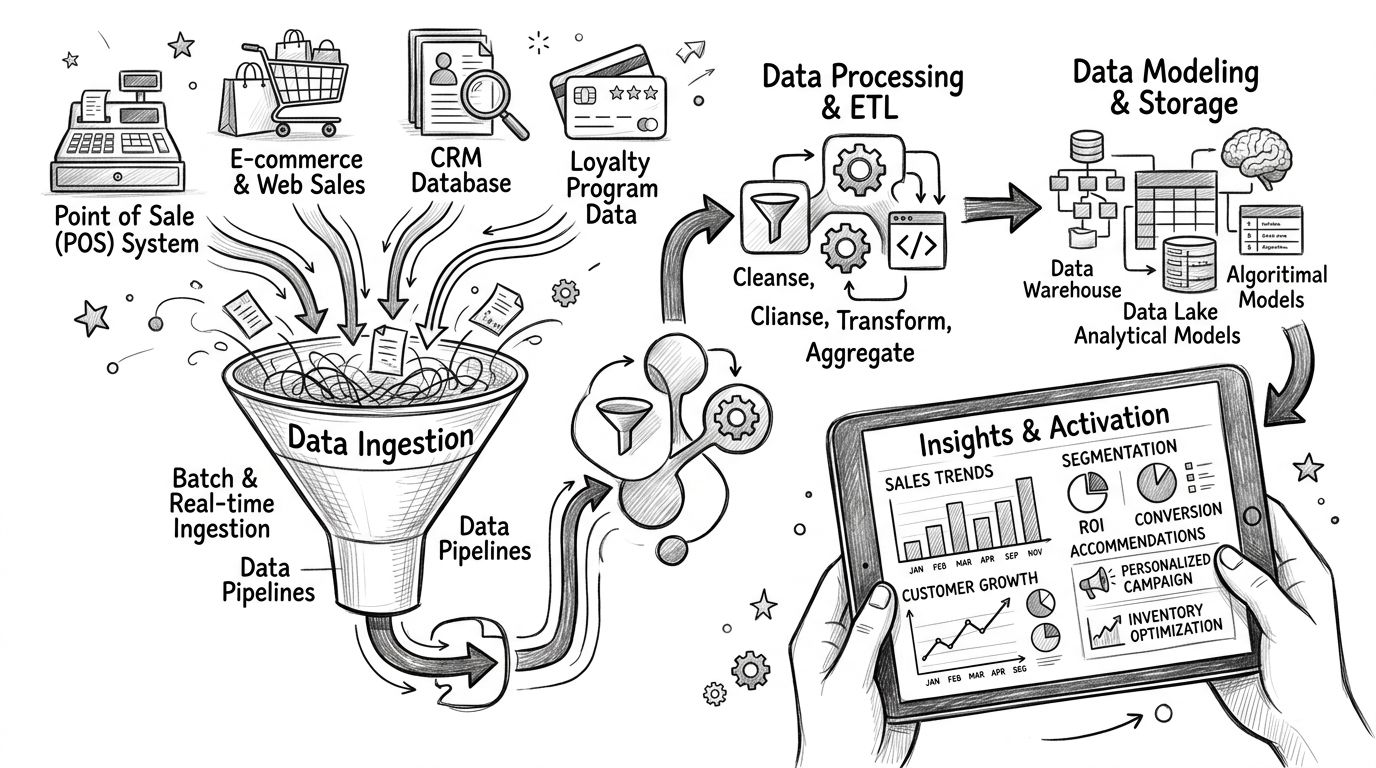
An illustration showing how retail data flows from POS and web systems into actionable business intelligence insights.

A practical way to understand retail BI is to view it as a store backroom for data. If products arrive unlabeled, inventory counts are late, and shelves are organized differently in every aisle, the front of the store suffers. BI works the same way. Dashboards only work well when the flow underneath is clean, timely, and organized for decisions.

The four layers SMB retailers should understand

Most SMB retail setups can be explained with four layers. You do not need an enterprise-sized stack to use this model. You do need each layer to be clear.

  1. Ingestion
    Data comes in from source systems such as POS, Shopify, WooCommerce, CRM tools, loyalty platforms, email tools, and supply-chain systems.

  2. Processing The platform cleans and standardizes records, fixing duplicate customers, inconsistent SKU names, missing store IDs, and broken timestamps.

  3. Modeling Data is organized into business entities your team can analyze. Sales, customers, products, campaigns, and locations become connected tables instead of isolated exports.

  4. Activation
    Insights are put to work. That can mean alerts for low stock, customer audience syncs for retention campaigns, or AI recommendations for replenishment and next-best action.

For SMBs, a key shift is not “more dashboards.” It is having one system handle the full path from raw retail data to action. Unified platforms such as Stamina are built for this model, which matters when a smaller team needs real-time reporting and AI support without maintaining a patchwork of tools. Microsoft's retail data architecture guidance is a useful reference because it shows how retail data pipelines connect operations, analytics, and action.

Mapping common retail data sources

SMB retailers usually have fewer systems than large chains, but the same integration problems appear fast. A store POS may record one product name, Shopify another, and the email platform may know the customer by a different identifier entirely.

Common sources usually fit the pipeline like this:

  • POS systems provide transaction data, basket contents, timestamps, returns, and store-level sales.

  • E-commerce platforms add online orders, product views, cart activity, and checkout behavior.

  • CRM and loyalty tools contribute customer profiles, repeat purchase history, support interactions, and loyalty status.

  • Email and campaign platforms show sends, opens, clicks, audience membership, and campaign timing.

  • Supply-chain and inventory systems provide stock levels, purchase orders, vendor data, and fulfillment status.

  • Clickstream and web analytics tools capture browsing paths, landing-page behavior, and drop-off points.

When those systems stay disconnected, teams fall back to spreadsheet stitching. That is reporting by rescue mission, not a repeatable BI process. This explanation of ad hoc reporting helps clarify where one-off analysis is useful and where it starts to slow a growing retail team down.

Where AI fits without making the stack mysterious

AI is most useful inside the pipeline, not floating above it as a separate project.

A demand forecast uses recent sales, stock movement, seasonality, and campaign activity. A personalization model groups customers based on purchase and browsing behavior. A pricing model flags unusual shifts in response after a promotion or markup. Each model depends on the same foundation. Clean joins, shared product definitions, and timely data refreshes.

That is why SMB teams should resist buying “AI” as a standalone promise. If the architecture is weak, the model just produces faster confusion. If the architecture is unified, AI can help the team react while there is still time to change inventory, offers, or campaign timing.

Clean data does not guarantee good decisions. Messy data makes bad decisions much more likely.

The practical roadmap is simple. Start with the systems that drive daily retail decisions. POS, e-commerce, inventory, and customer data. Bring them into one usable structure first. Then layer on real-time alerts, operational dashboards, and AI models your team can trust.

Implementation Steps and Common Pitfalls

Retail BI projects often fail for ordinary reasons. The team buys software before defining the question. They build dashboards before cleaning product data. They assume staff will adopt new reports because leadership announced them.

A simpler path works better, especially for SMBs. That matters because nearly 70% of retailers rely on BI for forecasting, segmentation, and pricing optimization, and the market is projected to reach $7.7 billion by 2029. Adoption is growing. Good implementation still separates useful systems from abandoned ones.

A six-step roadmap that fits smaller teams

Step 1: Start with business objectives
Choose a small set of questions that matter financially. For example, are you trying to reduce stock imbalances, improve repeat purchase behavior, or align online demand with store operations?

Step 2: Audit the data you already have
List every source the team depends on. POS, e-commerce, CRM, loyalty, inventory, campaign tools. Then check basic reliability. Are customer IDs consistent? Are SKUs named the same way everywhere?

Step 3: Pick an architecture your team can maintain
SMBs rarely need a sprawling custom stack on day one. They do need a setup that can unify key systems without constant manual work.

Step 4: Build a focused dashboard set
Don't launch with twenty dashboards. Start with a small operating view that helps merchandising, marketing, and operations answer recurring questions quickly.

Step 5: Train users by role
A store operator, marketer, and owner won't use BI the same way. Train around decisions, not features.

Step 6: Create a regular optimization loop
The first dashboard is never the final dashboard. Review what people use, what they ignore, and where new actions should be automated. If your team wants a simple way to operationalize those handoffs, this guide on how to create a workflow is helpful.

Three pitfalls that catch SMB retailers

  • Poor data quality: Teams often discover too late that product names, channels, or customer records don't match. That creates arguments about whose report is “correct.”

  • Weak change management: Even a good BI system fails if buyers, marketers, and store managers still rely on private spreadsheets.

  • No scalability plan: A setup that works for one store or one channel can become fragile as the business adds locations, campaigns, or product categories.

A dashboard people don't trust becomes decoration.

One practical safeguard is to assign ownership clearly. Someone should own product data consistency. Someone should own customer identity rules. Someone should own dashboard reviews. Retail BI doesn't fail because “the business” forgot. It fails because no person was accountable for the messy middle.

Choosing the Right BI Vendor for SMBs

Vendor selection gets framed too often as a feature contest. More charts, more connectors, more AI labels. SMB retailers usually need something less flashy and more useful. They need a tool they can run without hiring a full analytics department.

The biggest decision is often whether to stitch together point tools or choose a unified platform. Point tools can work when a business has strong internal data skills and enough time to manage the handoffs. Many SMBs don't.
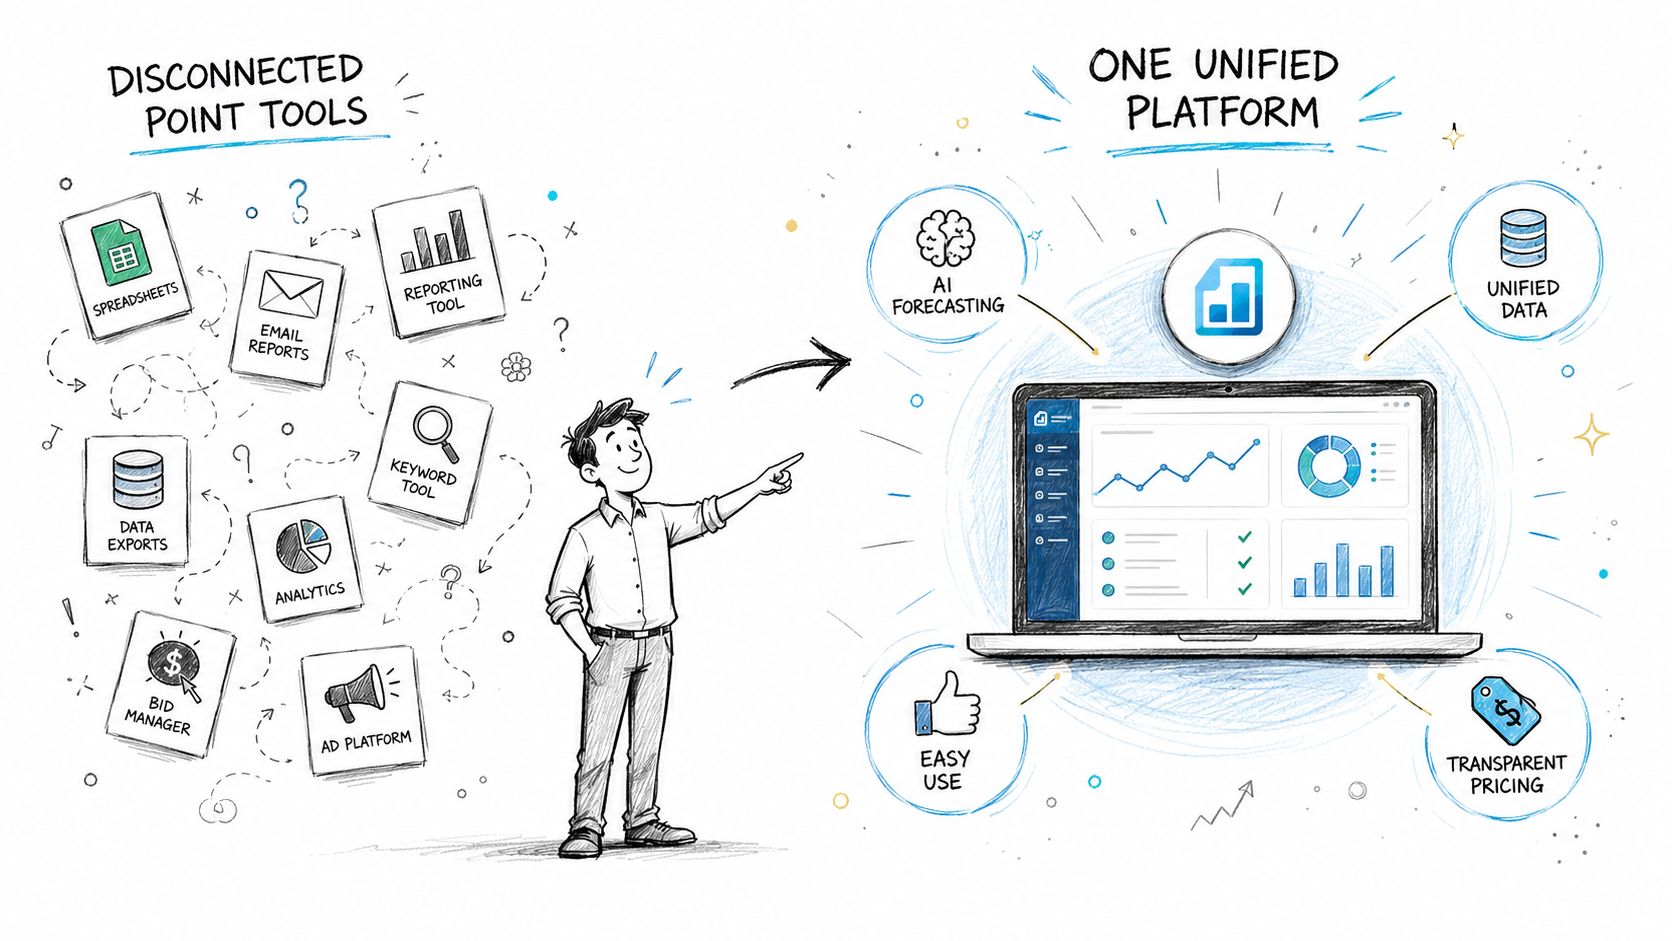
A cartoon illustration showing the transition from disconnected business point tools to a single unified dashboard platform.

What matters more than a long feature list

A strong SMB-friendly BI vendor should make a few things easy.

  • Data unification: Can it bring together marketing, sales, CRM, and retail activity into one working view?

  • Usable AI: Does the AI support real tasks such as forecasting, segmentation, and personalization, or does it just summarize charts?

  • Low-friction adoption: Can non-technical users answer common questions without submitting requests to specialists?

  • Activation paths: Can insights feed actions, not just dashboards?

  • Clear pricing and scope: SMB teams need to know what they're buying, what setup takes, and which limits appear later.

Point tools versus unified platforms

Point tools often look affordable at first because each tool handles one job well. One for dashboards. One for email. One for CRM. One for automation. One for segmentation.

The hidden cost appears in the gaps between them. Customer records drift. Campaign data arrives late. Sales and marketing teams debate attribution. Reporting becomes a reconciliation exercise.

Unified platforms reduce that coordination burden. They won't solve every data problem automatically, but they can give smaller teams a more realistic path to a single source of truth. For SMBs trying to build real-time BI without enterprise-scale staffing, that matters more than having the most advanced standalone visualization feature.

Questions to ask before signing

Ask vendors how their platform handles these practical situations:

  • A customer buys online after first engaging with an email campaign.

  • A product starts selling quickly in one location but slows elsewhere.

  • A marketer wants to build a segment based on behavior, not just static lists.

  • A sales or customer team needs the same account view as marketing.

  • A workflow should trigger from a business event, not from manual report review.

If the vendor's answer still depends on exporting CSV files between systems, the platform probably isn't reducing complexity. It's moving it around.

For SMB retailers, the best BI vendor is usually the one that removes handoffs, keeps data close to action, and lets the team operate from one consistent version of the business.

Measuring ROI and Next Steps for SMBs

ROI in retail BI gets murky when teams stop at “better visibility.” Visibility matters, but finance won't approve tools based on cleaner charts alone. ROI gets clearer when you tie BI to a business outcome and compare gain against cost.

A simple formula works:

ROI = (incremental value created by BI - incremental cost of BI) / incremental cost of BI

What counts as value

For SMB retailers, incremental value often shows up in a few places:

  • Revenue lift from better targeting

  • Margin protection from smarter pricing decisions

  • Reduced waste from better inventory timing

  • Time saved from replacing manual reporting

  • Improved campaign efficiency from sharper personalization

Location data is a useful example because many retailers know it matters but struggle to prove it. Retailers integrating location intelligence into BI saw an 18–24% increase in campaign personalization accuracy, yet only 9% of guides include concrete ROI frameworks for this investment. The lesson isn't just that location data can help. It's that SMB teams should define in advance how they'll connect better personalization to campaign response, store traffic patterns, or digital conversion.

A practical way to measure a pilot

Instead of trying to justify BI for the whole business at once, run a contained pilot.

Choose one category, one customer segment, or one region. Define the baseline. Then compare outcomes after BI-driven changes are introduced. Keep the scope narrow enough that the result is understandable.

Start with one costly decision that happens often. If BI improves that decision, the business case gets easier fast.

Three immediate next steps usually make sense for SMB retailers:

  1. Audit your current data flow
    List the systems that hold customer, sales, inventory, and campaign data. Note where manual exports still happen.

  2. Pilot a unified BI and CRM operating model
    Pick one use case such as replenishment alerts, campaign segmentation, or omnichannel attribution.

  3. Train a cross-functional team
    Include someone from operations, marketing, and sales or customer management. BI adoption sticks when multiple teams trust the same signals.

If your team wants to replace disconnected point tools with one AI-powered system for marketing, sales, and CRM, Stamina is worth a look. It gives growing SMBs a single source of truth, plus automation and workflow tools that help turn business intelligence into action instead of more reporting work.

A small retail team can spend half its week hunting for answers that should be obvious. One spreadsheet tracks store sales. Another holds Shopify orders. A third comes from the email platform. Inventory lives somewhere else. By the time someone merges the files, the promotion is over and the stock problem has already reached the store floor.

That's why the most important retail BI story isn't about prettier dashboards. It's about the gap between what retailers need and what small teams are able to run. 73% of retailers cite the need for real-time intelligence, but only 12% of SMBs have the infrastructure for continuous AI-driven replenishment and pricing optimization. That gap is where many growing retailers get stuck.

Introduction to Retail BI for SMBs

Consider a local retail brand with three stores, an online shop, and a lean team. The owner checks POS reports in the morning, the e-commerce manager watches online orders, and the marketer exports email results every Friday. Everyone has data. No one has the same version of the business.

That's the practical starting point for business intelligence in the retail industry. BI gives a retail team one place to see what's selling, what's slowing down, which customers are responding, and where action is needed next. For a small business, that doesn't mean building an enterprise data department. It means replacing scattered reports with a system that helps people decide faster.

The confusion usually starts with the phrase “real-time BI.” Many SMB teams assume it means expensive infrastructure, full-time analysts, and a complete rebuild of their tech stack. It doesn't have to. Real-time BI means the business isn't waiting for end-of-week summaries to react to stock shifts, customer behavior, or campaign performance.

Practical rule: If your team still needs to copy data from one tool into another before making a decision, you don't have a BI workflow yet. You have reporting labor.

Retailers also mix up BI with customer engagement tools. They're connected, but they aren't the same. BI tells you what is happening and what action makes sense. Engagement tools help you deliver that action across channels. If you want a useful primer on that second piece, this explanation of a customer engagement platform helps clarify where communication and analytics meet.

For SMB retailers, the goal isn't to become “data-driven” in some abstract way. The goal is simpler. Spot a likely stockout before it hurts sales. Notice when a campaign is pulling online demand from a specific store region. Identify which customers respond to bundles instead of discounts. Then act while the moment still matters.

Understanding Business Intelligence in Retail Industry

Business intelligence in retail works like a store manager who can stand in every aisle, watch every checkout, compare every channel, and alert the team before a problem gets expensive. Traditional reporting gave that manager a clipboard after the fact. Modern BI gives them a live control room.

A split image contrasting a man doing manual paper work versus using digital business intelligence analytics tools.

From reporting to action

Older BI setups mostly answered one question. What happened?

You'd open a dashboard, review yesterday's sales, and maybe notice that one SKU underperformed in one store. That's useful, but it's late. Someone still has to interpret the chart, send an email, and update a system manually.

Modern retail BI has changed shape. Retail BI platforms now combine data ingestion, modeling, and activation in one continuous pipeline, shifting from periodic reporting to prescriptive, automated decisioning in milliseconds. That sentence sounds technical, so let's translate it.

It means the platform doesn't stop at showing you a chart. It can connect incoming data to a recommended action. If inventory drops quickly on a promoted item, the system can flag replenishment risk immediately. If certain customers are responding to a category on mobile but not in-store, the team can adjust targeting or merchandising without waiting for a weekly review.

That's why many teams now talk less about dashboards and more about decision systems. If you want a thoughtful outside perspective on that shift, Trackingplan's guide to autonomous business intelligence is a useful companion read.

What this looks like in daily retail work

In practice, retail BI touches familiar tasks:

  • Stock decisions: Which products need a reorder signal now, not tomorrow.

  • Pricing moves: Which categories may need tighter monitoring when demand changes quickly.

  • Promotion timing: Which campaigns are lifting response in one channel but not another.

  • Customer experience: Which shoppers are engaging with recommendations, abandoned carts, or repeat purchase patterns.

  • Store operations: Which locations are aligned with online demand and which are drifting.

The easiest way to understand the shift is this. A dashboard is like a rearview mirror. A modern BI system is closer to assisted driving.

A short visual walkthrough helps make that leap concrete:

Retail teams don't need more charts if the charts still leave the next move unclear.

Why omnichannel makes BI harder and more necessary

Retail used to tolerate separate systems because store and online operations were often run separately. That breaks down fast when customers move between channels without thinking about it. A shopper might discover a product on Instagram, compare it on the website, then buy it in-store. If your data lives in silos, your team sees fragments of one journey and mistakes them for separate stories.

That's why modern BI matters so much in retail. It doesn't just summarize activity. It helps teams connect behavior, demand, and response across channels so decisions match how customers shop.

Key Retail BI Metrics and Use Cases

Metrics matter because they narrow attention. A retail team can stare at dozens of charts and still miss the core issue. The best BI metrics answer a practical question tied to revenue, cost, or customer response.

Retailers implementing comprehensive BI solutions report an average 8.4% increase in sales volume within the first year and a 12.3% higher growth rate when they unify online and offline data. Those results help explain why the right metrics are more than reporting hygiene. They shape action.

The metrics that actually guide decisions

Some SMB teams over-focus on top-line sales because it's easy to measure. Sales matter, of course, but they don't tell you whether inventory is healthy, whether pricing is sustainable, or whether valuable customers are becoming more loyal.

Here's a decision-ready view of core retail BI metrics.

Metric

Definition

Impact

Inventory turnover

How often inventory sells through and is replaced over a period

Helps buyers reduce overstocks and spot slow-moving items before cash gets trapped

Forecast accuracy

How closely predicted demand matches actual demand

Improves purchasing, staffing, and replenishment decisions

Customer lifetime value

The expected value of a customer relationship over time

Helps marketers decide where retention and loyalty efforts deserve more focus

Price elasticity

How customer demand changes when price changes

Guides discount strategy and protects margin when testing pricing moves

Attribution rate

How clearly a sale can be connected to a campaign, channel, or touchpoint

Helps teams understand which actions are influencing purchases across online and offline journeys

How each metric shows up in real stores

Inventory turnover is often the first wake-up call. If one store keeps reordering a product that sits untouched while another location sells out, the issue may not be demand alone. It may be assortment, placement, or timing. BI helps the team see the mismatch early.

Forecast accuracy becomes critical during promotions and seasonal shifts. A spreadsheet forecast built from last month's sales often misses current behavior. BI tools pull in richer signals and make forecast adjustments easier to trust.

For teams that need a grounding in prediction methods, this guide to sales forecasting is a practical companion.

Customer lifetime value helps smaller retailers stop treating every buyer the same. A discount for a one-time bargain hunter and a personalized offer for a repeat customer shouldn't come from the same playbook.

Useful test: If your team can't explain which customer group deserves a retention offer and which group only needs low-cost nurture, your BI metrics aren't connected to action yet.

Price elasticity sounds advanced, but the logic is simple. Some products can handle a price shift with little drop in demand. Others can't. BI makes those patterns easier to observe across stores, channels, and periods.

Attribution rate becomes especially important in omnichannel retail, where a customer rarely buys in the same place they first engaged. If your email, paid social, web visits, and in-store purchases remain disconnected, your team may overfund the wrong campaign.

For a concrete operations example outside classic retail dashboards, Pipecorn's Foodcheri case study is useful because it shows how better data flow can support execution, not just reporting.

Use cases SMB teams can prioritize first

Instead of tracking everything, start where the business feels pain:

  • Recurring stock imbalances: Focus on turnover and forecast accuracy.

  • Discount-heavy growth: Track price elasticity and gross response by segment.

  • Weak repeat purchase behavior: Watch customer lifetime value patterns and cohort behavior.

  • Channel confusion: Improve attribution across in-store and digital activity.

The strongest retail BI programs don't begin with more KPIs. They begin with a few metrics that answer costly questions clearly.

Architecture and Data Sources for Retail BI

Retail BI architecture decides whether your team gets answers in time to act or spends the week stitching together exports. For SMB retailers, that difference often comes down to one question. Do your sales, customer, inventory, and campaign systems feed one shared model, or do they live in separate tools that never fully agree?

An illustration showing how retail data flows from POS and web systems into actionable business intelligence insights.

A practical way to understand retail BI is to view it as a store backroom for data. If products arrive unlabeled, inventory counts are late, and shelves are organized differently in every aisle, the front of the store suffers. BI works the same way. Dashboards only work well when the flow underneath is clean, timely, and organized for decisions.

The four layers SMB retailers should understand

Most SMB retail setups can be explained with four layers. You do not need an enterprise-sized stack to use this model. You do need each layer to be clear.

  1. Ingestion
    Data comes in from source systems such as POS, Shopify, WooCommerce, CRM tools, loyalty platforms, email tools, and supply-chain systems.

  2. Processing The platform cleans and standardizes records, fixing duplicate customers, inconsistent SKU names, missing store IDs, and broken timestamps.

  3. Modeling Data is organized into business entities your team can analyze. Sales, customers, products, campaigns, and locations become connected tables instead of isolated exports.

  4. Activation
    Insights are put to work. That can mean alerts for low stock, customer audience syncs for retention campaigns, or AI recommendations for replenishment and next-best action.

For SMBs, a key shift is not “more dashboards.” It is having one system handle the full path from raw retail data to action. Unified platforms such as Stamina are built for this model, which matters when a smaller team needs real-time reporting and AI support without maintaining a patchwork of tools. Microsoft's retail data architecture guidance is a useful reference because it shows how retail data pipelines connect operations, analytics, and action.

Mapping common retail data sources

SMB retailers usually have fewer systems than large chains, but the same integration problems appear fast. A store POS may record one product name, Shopify another, and the email platform may know the customer by a different identifier entirely.

Common sources usually fit the pipeline like this:

  • POS systems provide transaction data, basket contents, timestamps, returns, and store-level sales.

  • E-commerce platforms add online orders, product views, cart activity, and checkout behavior.

  • CRM and loyalty tools contribute customer profiles, repeat purchase history, support interactions, and loyalty status.

  • Email and campaign platforms show sends, opens, clicks, audience membership, and campaign timing.

  • Supply-chain and inventory systems provide stock levels, purchase orders, vendor data, and fulfillment status.

  • Clickstream and web analytics tools capture browsing paths, landing-page behavior, and drop-off points.

When those systems stay disconnected, teams fall back to spreadsheet stitching. That is reporting by rescue mission, not a repeatable BI process. This explanation of ad hoc reporting helps clarify where one-off analysis is useful and where it starts to slow a growing retail team down.

Where AI fits without making the stack mysterious

AI is most useful inside the pipeline, not floating above it as a separate project.

A demand forecast uses recent sales, stock movement, seasonality, and campaign activity. A personalization model groups customers based on purchase and browsing behavior. A pricing model flags unusual shifts in response after a promotion or markup. Each model depends on the same foundation. Clean joins, shared product definitions, and timely data refreshes.

That is why SMB teams should resist buying “AI” as a standalone promise. If the architecture is weak, the model just produces faster confusion. If the architecture is unified, AI can help the team react while there is still time to change inventory, offers, or campaign timing.

Clean data does not guarantee good decisions. Messy data makes bad decisions much more likely.

The practical roadmap is simple. Start with the systems that drive daily retail decisions. POS, e-commerce, inventory, and customer data. Bring them into one usable structure first. Then layer on real-time alerts, operational dashboards, and AI models your team can trust.

Implementation Steps and Common Pitfalls

Retail BI projects often fail for ordinary reasons. The team buys software before defining the question. They build dashboards before cleaning product data. They assume staff will adopt new reports because leadership announced them.

A simpler path works better, especially for SMBs. That matters because nearly 70% of retailers rely on BI for forecasting, segmentation, and pricing optimization, and the market is projected to reach $7.7 billion by 2029. Adoption is growing. Good implementation still separates useful systems from abandoned ones.

A six-step roadmap that fits smaller teams

Step 1: Start with business objectives
Choose a small set of questions that matter financially. For example, are you trying to reduce stock imbalances, improve repeat purchase behavior, or align online demand with store operations?

Step 2: Audit the data you already have
List every source the team depends on. POS, e-commerce, CRM, loyalty, inventory, campaign tools. Then check basic reliability. Are customer IDs consistent? Are SKUs named the same way everywhere?

Step 3: Pick an architecture your team can maintain
SMBs rarely need a sprawling custom stack on day one. They do need a setup that can unify key systems without constant manual work.

Step 4: Build a focused dashboard set
Don't launch with twenty dashboards. Start with a small operating view that helps merchandising, marketing, and operations answer recurring questions quickly.

Step 5: Train users by role
A store operator, marketer, and owner won't use BI the same way. Train around decisions, not features.

Step 6: Create a regular optimization loop
The first dashboard is never the final dashboard. Review what people use, what they ignore, and where new actions should be automated. If your team wants a simple way to operationalize those handoffs, this guide on how to create a workflow is helpful.

Three pitfalls that catch SMB retailers

  • Poor data quality: Teams often discover too late that product names, channels, or customer records don't match. That creates arguments about whose report is “correct.”

  • Weak change management: Even a good BI system fails if buyers, marketers, and store managers still rely on private spreadsheets.

  • No scalability plan: A setup that works for one store or one channel can become fragile as the business adds locations, campaigns, or product categories.

A dashboard people don't trust becomes decoration.

One practical safeguard is to assign ownership clearly. Someone should own product data consistency. Someone should own customer identity rules. Someone should own dashboard reviews. Retail BI doesn't fail because “the business” forgot. It fails because no person was accountable for the messy middle.

Choosing the Right BI Vendor for SMBs

Vendor selection gets framed too often as a feature contest. More charts, more connectors, more AI labels. SMB retailers usually need something less flashy and more useful. They need a tool they can run without hiring a full analytics department.

The biggest decision is often whether to stitch together point tools or choose a unified platform. Point tools can work when a business has strong internal data skills and enough time to manage the handoffs. Many SMBs don't.

A cartoon illustration showing the transition from disconnected business point tools to a single unified dashboard platform.

What matters more than a long feature list

A strong SMB-friendly BI vendor should make a few things easy.

  • Data unification: Can it bring together marketing, sales, CRM, and retail activity into one working view?

  • Usable AI: Does the AI support real tasks such as forecasting, segmentation, and personalization, or does it just summarize charts?

  • Low-friction adoption: Can non-technical users answer common questions without submitting requests to specialists?

  • Activation paths: Can insights feed actions, not just dashboards?

  • Clear pricing and scope: SMB teams need to know what they're buying, what setup takes, and which limits appear later.

Point tools versus unified platforms

Point tools often look affordable at first because each tool handles one job well. One for dashboards. One for email. One for CRM. One for automation. One for segmentation.

The hidden cost appears in the gaps between them. Customer records drift. Campaign data arrives late. Sales and marketing teams debate attribution. Reporting becomes a reconciliation exercise.

Unified platforms reduce that coordination burden. They won't solve every data problem automatically, but they can give smaller teams a more realistic path to a single source of truth. For SMBs trying to build real-time BI without enterprise-scale staffing, that matters more than having the most advanced standalone visualization feature.

Questions to ask before signing

Ask vendors how their platform handles these practical situations:

  • A customer buys online after first engaging with an email campaign.

  • A product starts selling quickly in one location but slows elsewhere.

  • A marketer wants to build a segment based on behavior, not just static lists.

  • A sales or customer team needs the same account view as marketing.

  • A workflow should trigger from a business event, not from manual report review.

If the vendor's answer still depends on exporting CSV files between systems, the platform probably isn't reducing complexity. It's moving it around.

For SMB retailers, the best BI vendor is usually the one that removes handoffs, keeps data close to action, and lets the team operate from one consistent version of the business.

Measuring ROI and Next Steps for SMBs

ROI in retail BI gets murky when teams stop at “better visibility.” Visibility matters, but finance won't approve tools based on cleaner charts alone. ROI gets clearer when you tie BI to a business outcome and compare gain against cost.

A simple formula works:

ROI = (incremental value created by BI - incremental cost of BI) / incremental cost of BI

What counts as value

For SMB retailers, incremental value often shows up in a few places:

  • Revenue lift from better targeting

  • Margin protection from smarter pricing decisions

  • Reduced waste from better inventory timing

  • Time saved from replacing manual reporting

  • Improved campaign efficiency from sharper personalization

Location data is a useful example because many retailers know it matters but struggle to prove it. Retailers integrating location intelligence into BI saw an 18–24% increase in campaign personalization accuracy, yet only 9% of guides include concrete ROI frameworks for this investment. The lesson isn't just that location data can help. It's that SMB teams should define in advance how they'll connect better personalization to campaign response, store traffic patterns, or digital conversion.

A practical way to measure a pilot

Instead of trying to justify BI for the whole business at once, run a contained pilot.

Choose one category, one customer segment, or one region. Define the baseline. Then compare outcomes after BI-driven changes are introduced. Keep the scope narrow enough that the result is understandable.

Start with one costly decision that happens often. If BI improves that decision, the business case gets easier fast.

Three immediate next steps usually make sense for SMB retailers:

  1. Audit your current data flow
    List the systems that hold customer, sales, inventory, and campaign data. Note where manual exports still happen.

  2. Pilot a unified BI and CRM operating model
    Pick one use case such as replenishment alerts, campaign segmentation, or omnichannel attribution.

  3. Train a cross-functional team
    Include someone from operations, marketing, and sales or customer management. BI adoption sticks when multiple teams trust the same signals.

If your team wants to replace disconnected point tools with one AI-powered system for marketing, sales, and CRM, Stamina is worth a look. It gives growing SMBs a single source of truth, plus automation and workflow tools that help turn business intelligence into action instead of more reporting work.

Share this article

Share this article

Send a shareable link to your team or anyone who might find it useful.

Send a shareable link to your team or anyone who might find it useful.

Copy link

Copied

Share directly to

Table of contents

Give Your Business the Stamina it needs to Thrive

PRODUCT

COMPANY

RESOURCES

© 2026 Stamina Software Technologies Inc. All rights reserved.

PRODUCT

COMPANY

RESOURCES

© 2026 Stamina Software Technologies Inc. All rights reserved.

PRODUCT

COMPANY

RESOURCES

© 2026 Stamina Software Technologies Inc. All rights reserved.